Market View 20230726
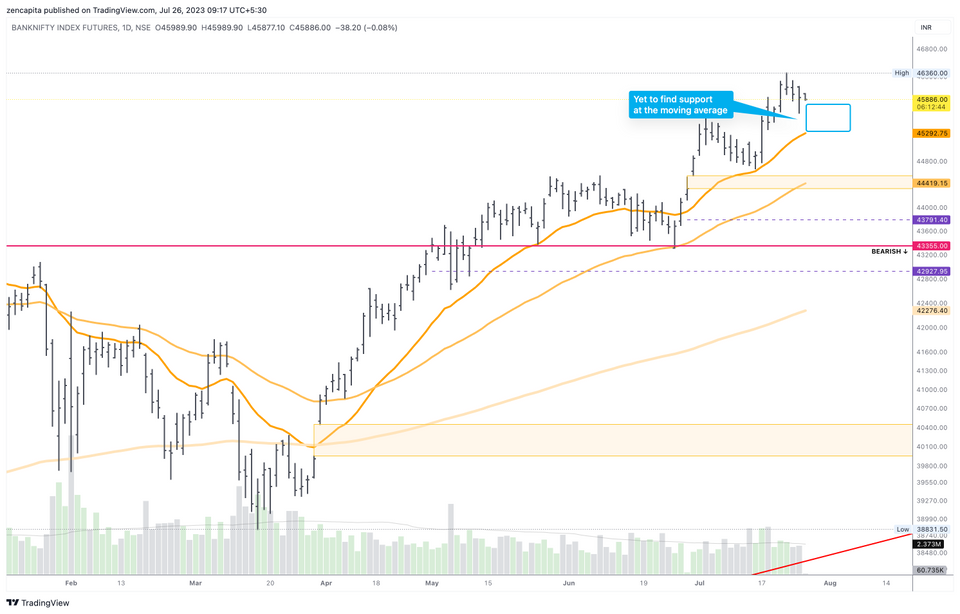
It looks like it could be another slow grind down to the moving average, and if we go by the previous move, it could lead to a further move up, after tapping the moving average.
Will have to hurry up and wait, for Fed meeting to be over tonight, meaning that tomorrow we have an interesting expiry ahead of us.
Okay, so today I'm going to be adding Pivot Highs & Pivot Lows, this is basically a trend following indicator to give us levels where there could be support & resistance.
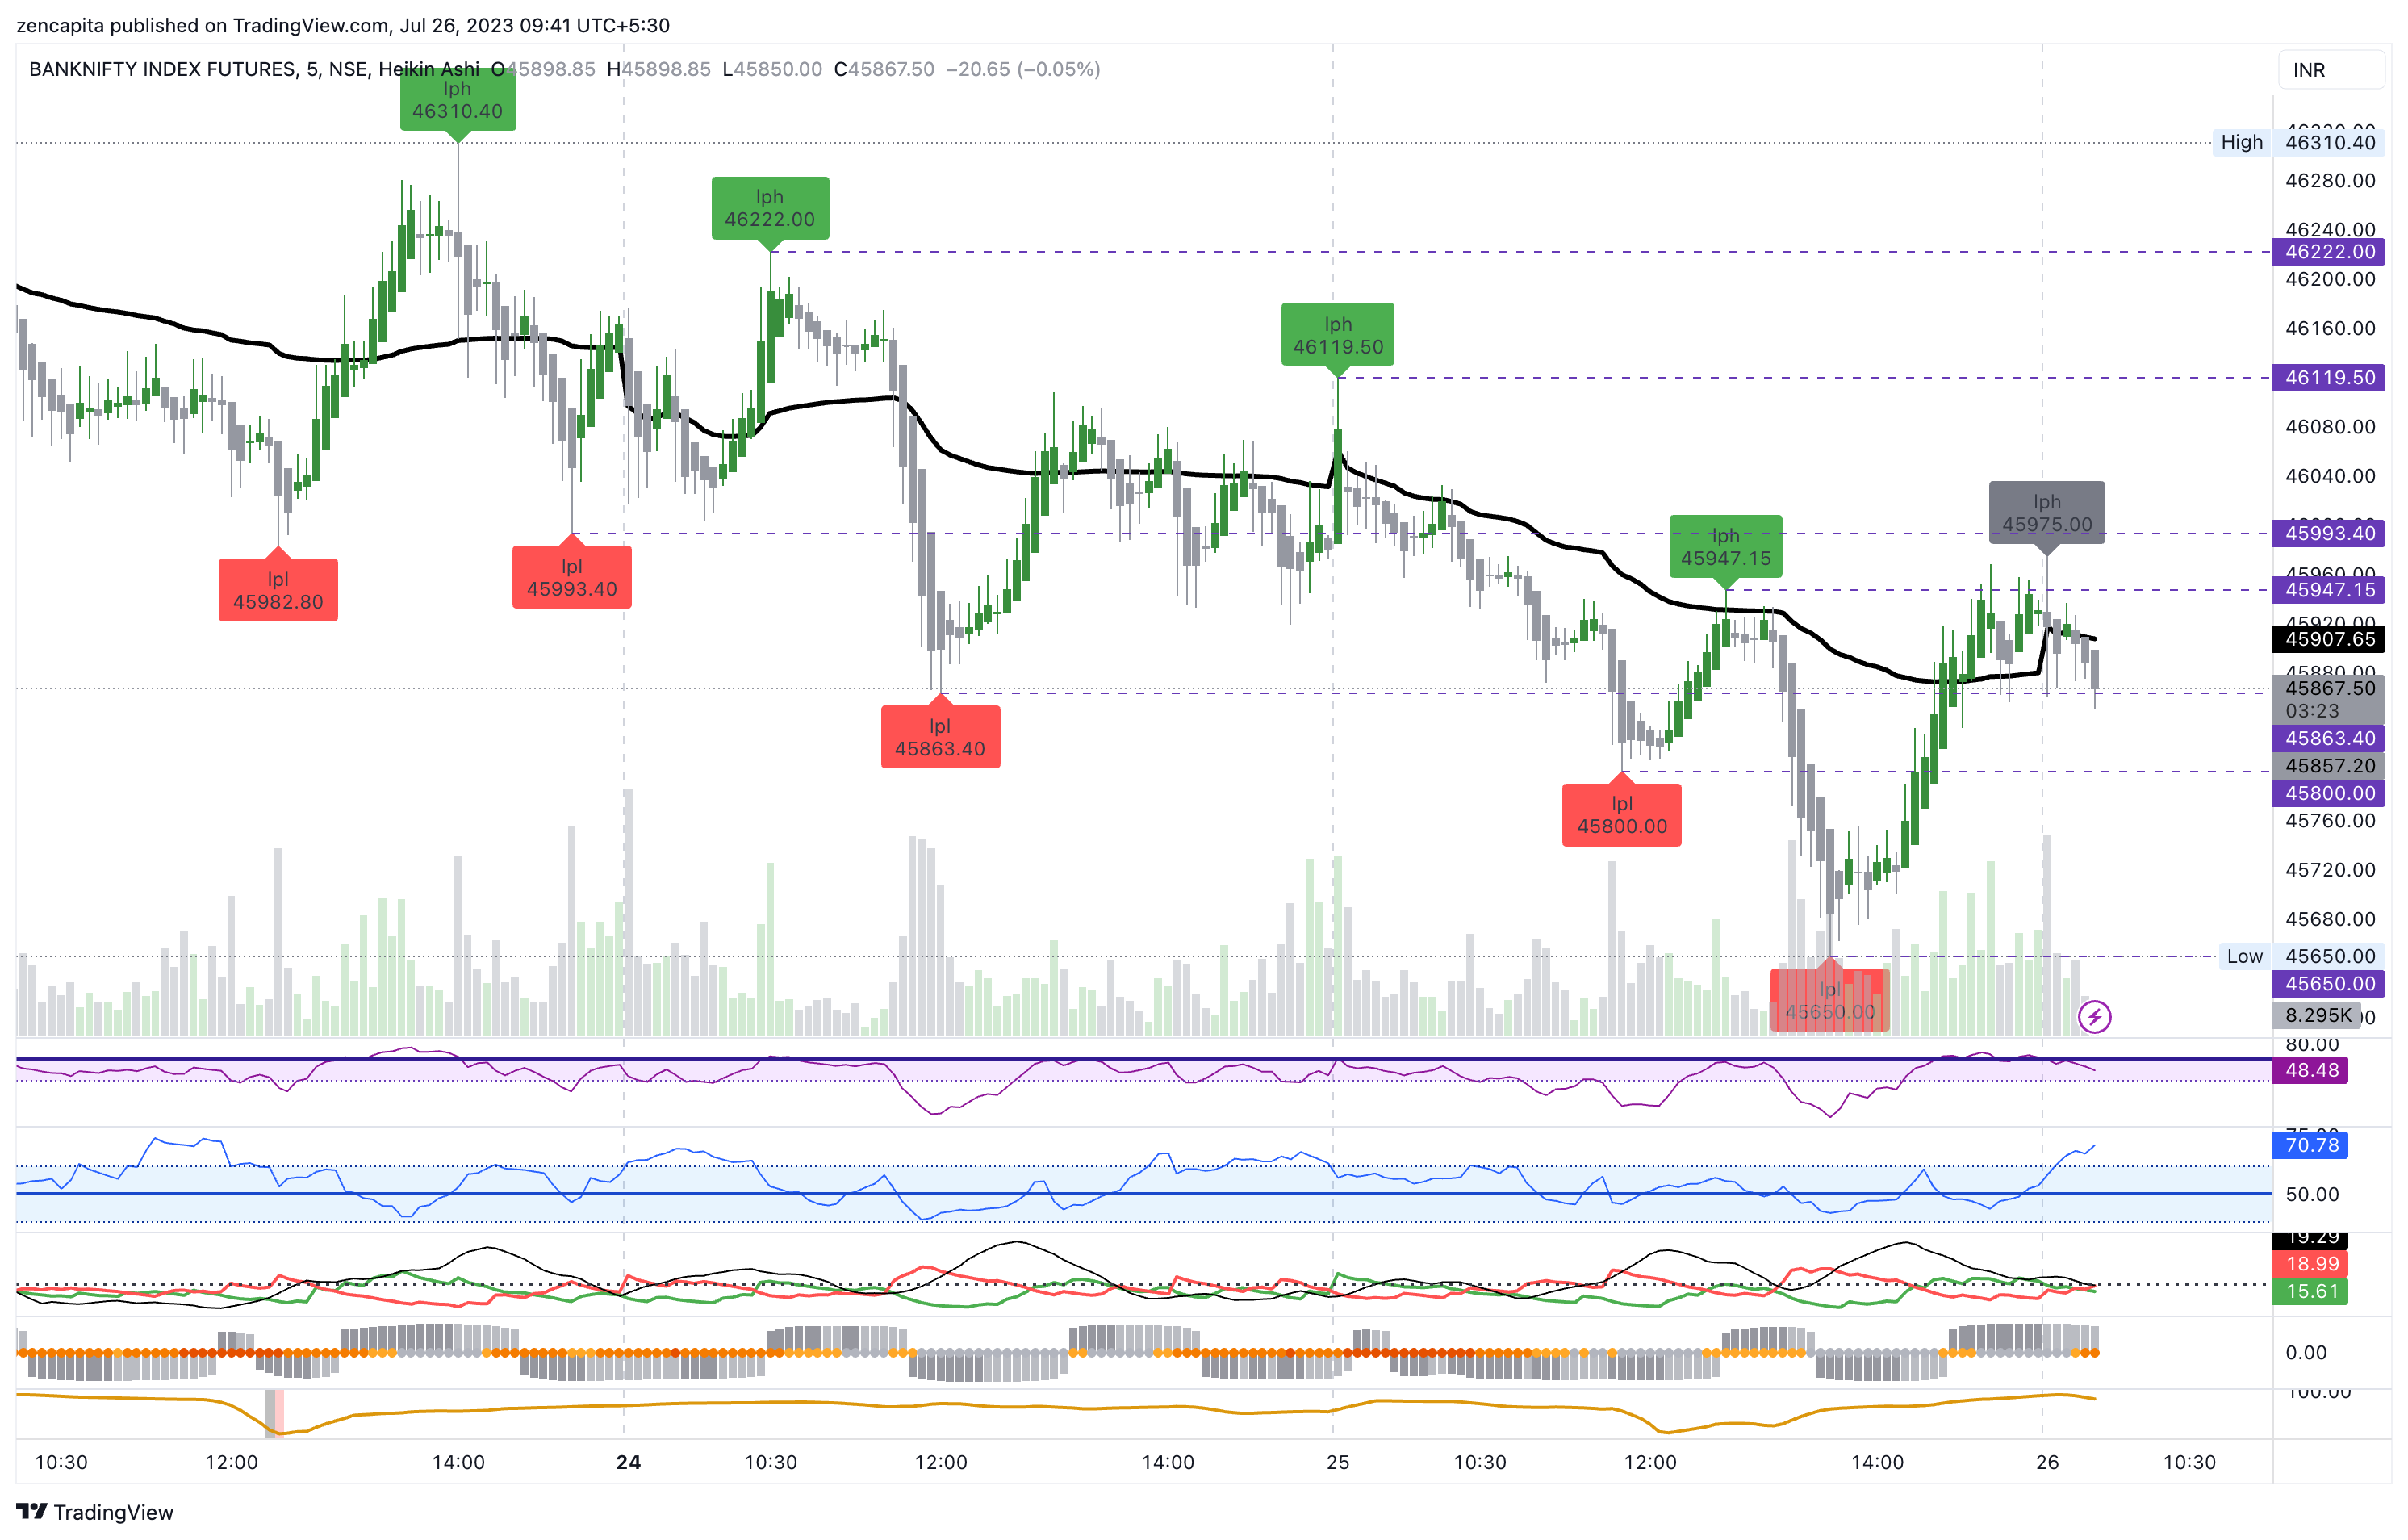
LPH = Large Pivot High, and LPL = Large Pivot Low. There are smaller pivot highs and lows, but I've ignored them to keep things simple. Also, from the chart we can see, LOWER highs and LOWER lows... which is an indication of a downward trend.
Right now, based on this, if we cross the LPL (Large Pivot Low) of 45650, the trend is bearish and will continue downwards. If however, we cross the grey coloured LPH (Large Pivot High), then that's an indication of a possible reversal.
So our range for now is between 45975 <> 45650, i.e. 325 points range. Tight, given the move we've seen in the last month. Nevertheless, let's watch these levels.
We have a crucial low at 45800 to break, let's see if that gets broken today.
1019am
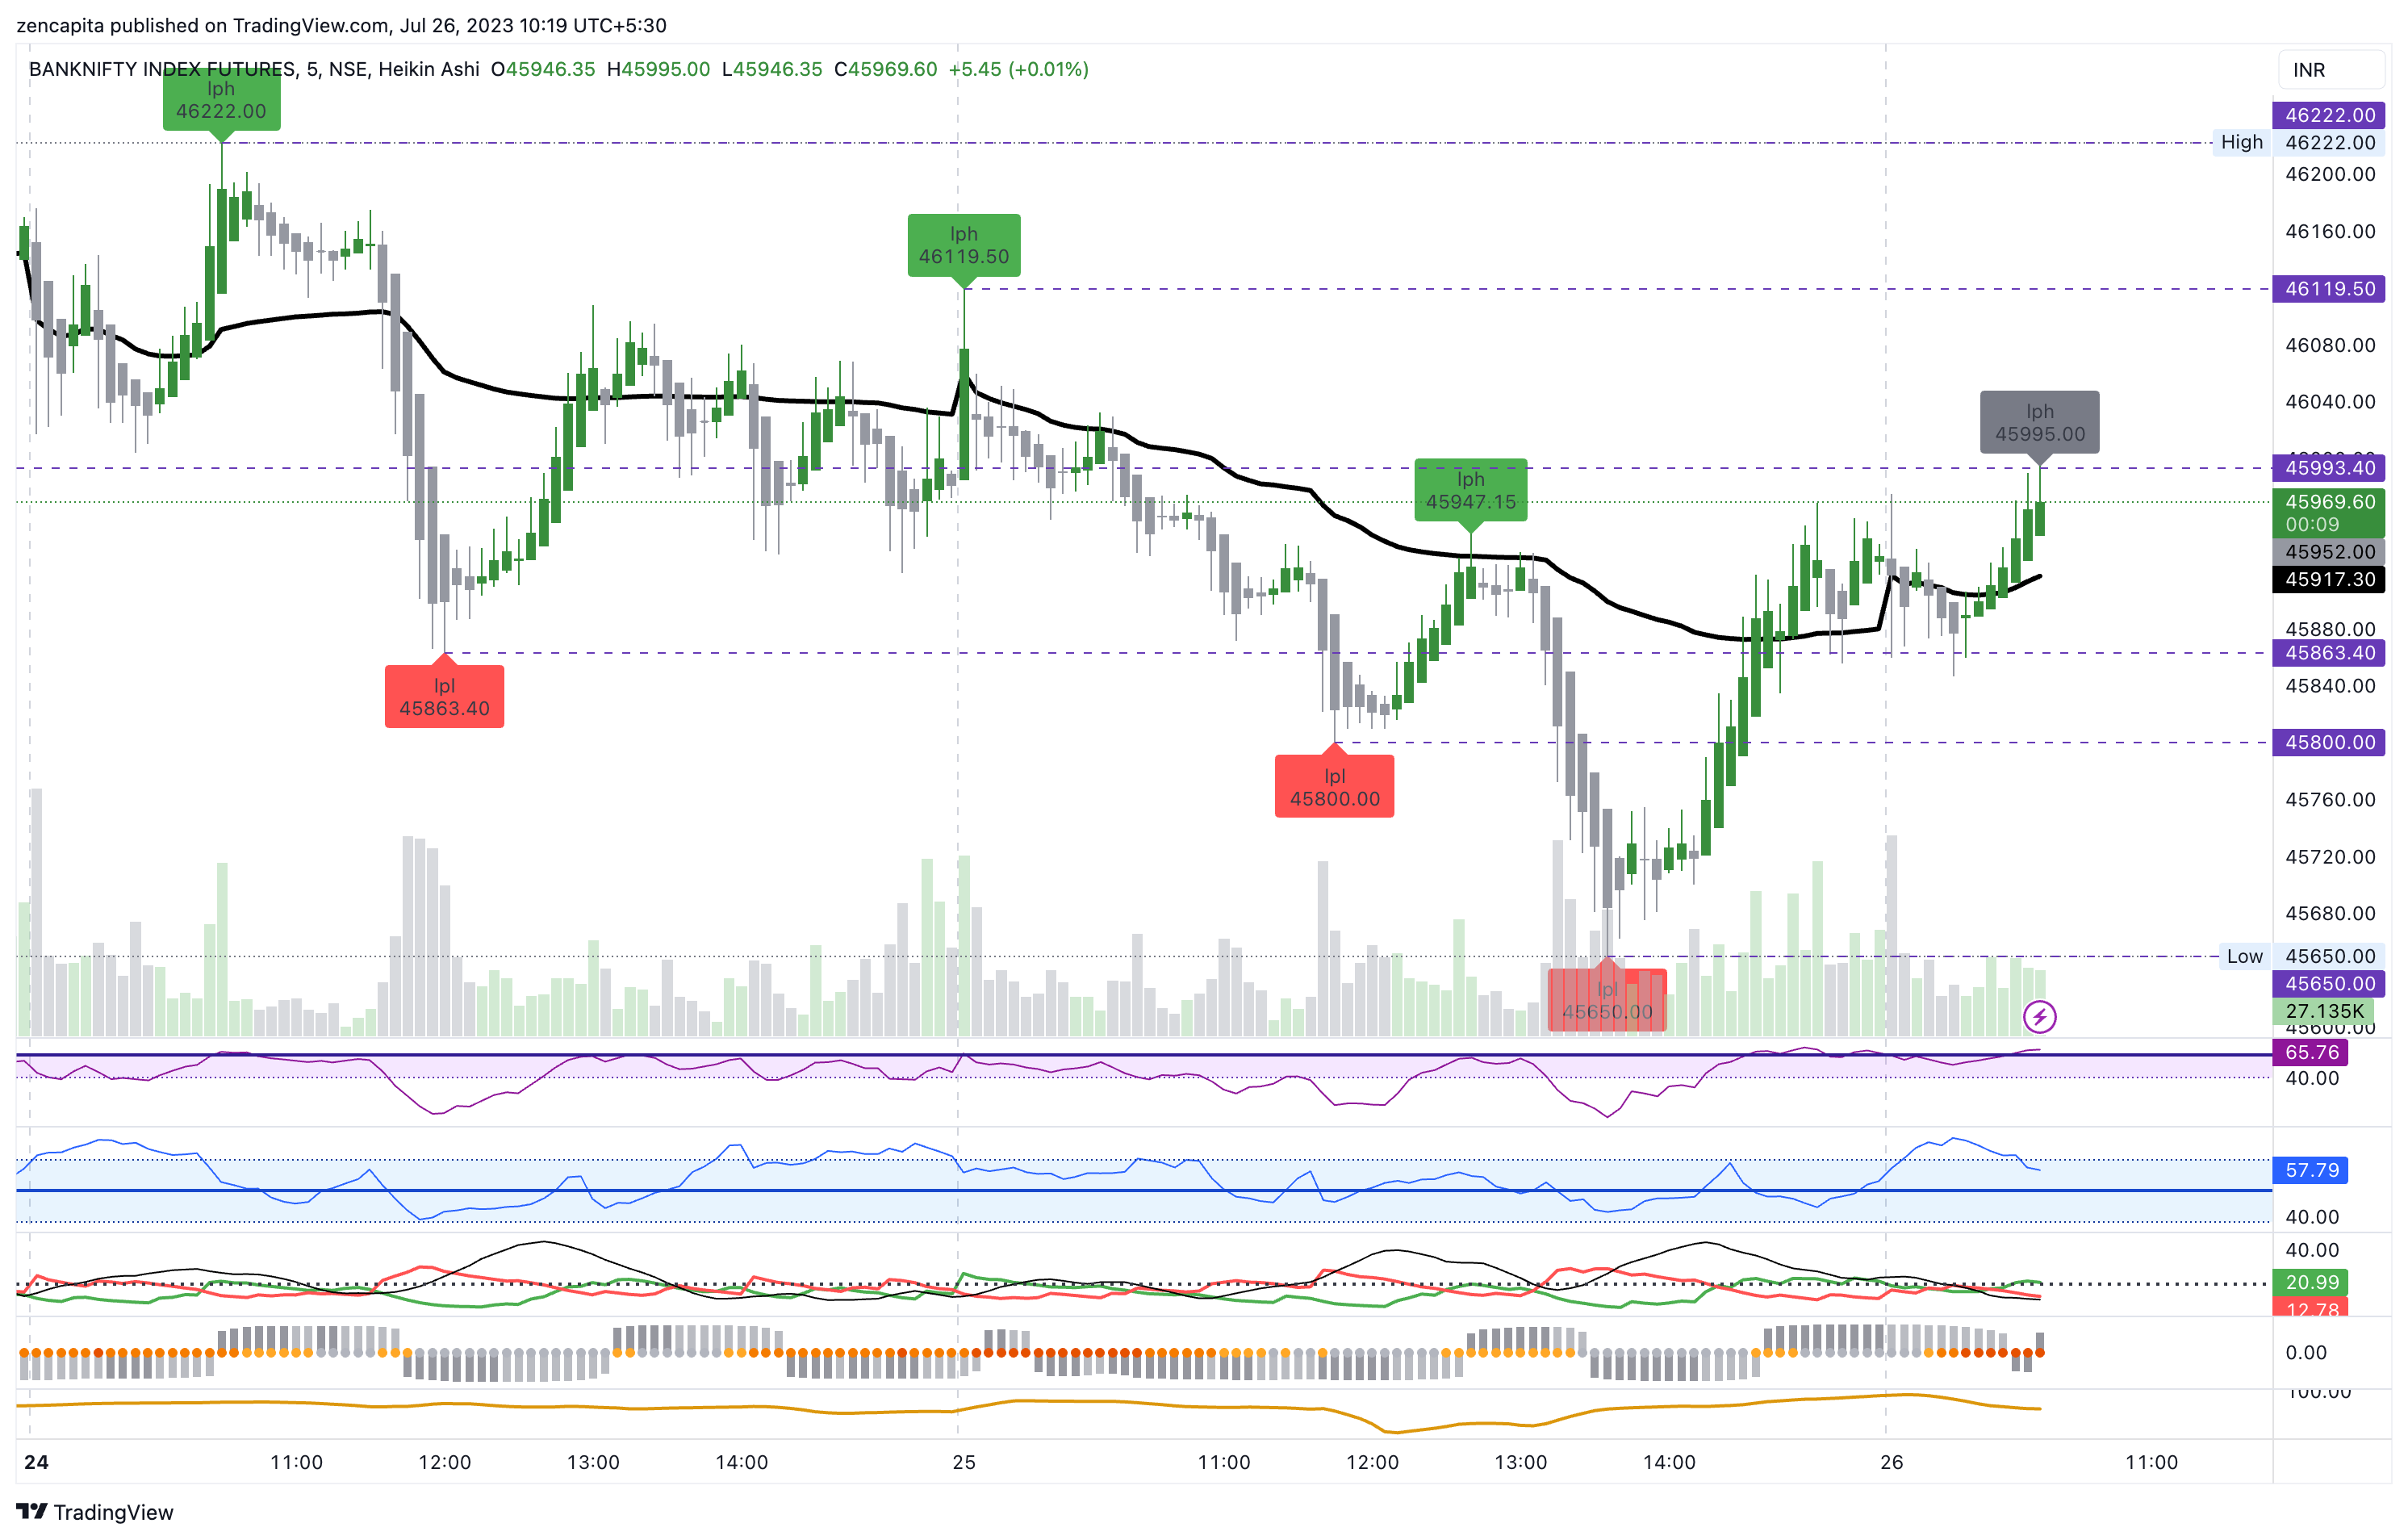
So within a short time, the LPH, has shifted to 45995. A 20 point move, but nonetheless a higher point. Let's see if this is a reversal, or just a final attempt before a move lower to 45650.
1055am
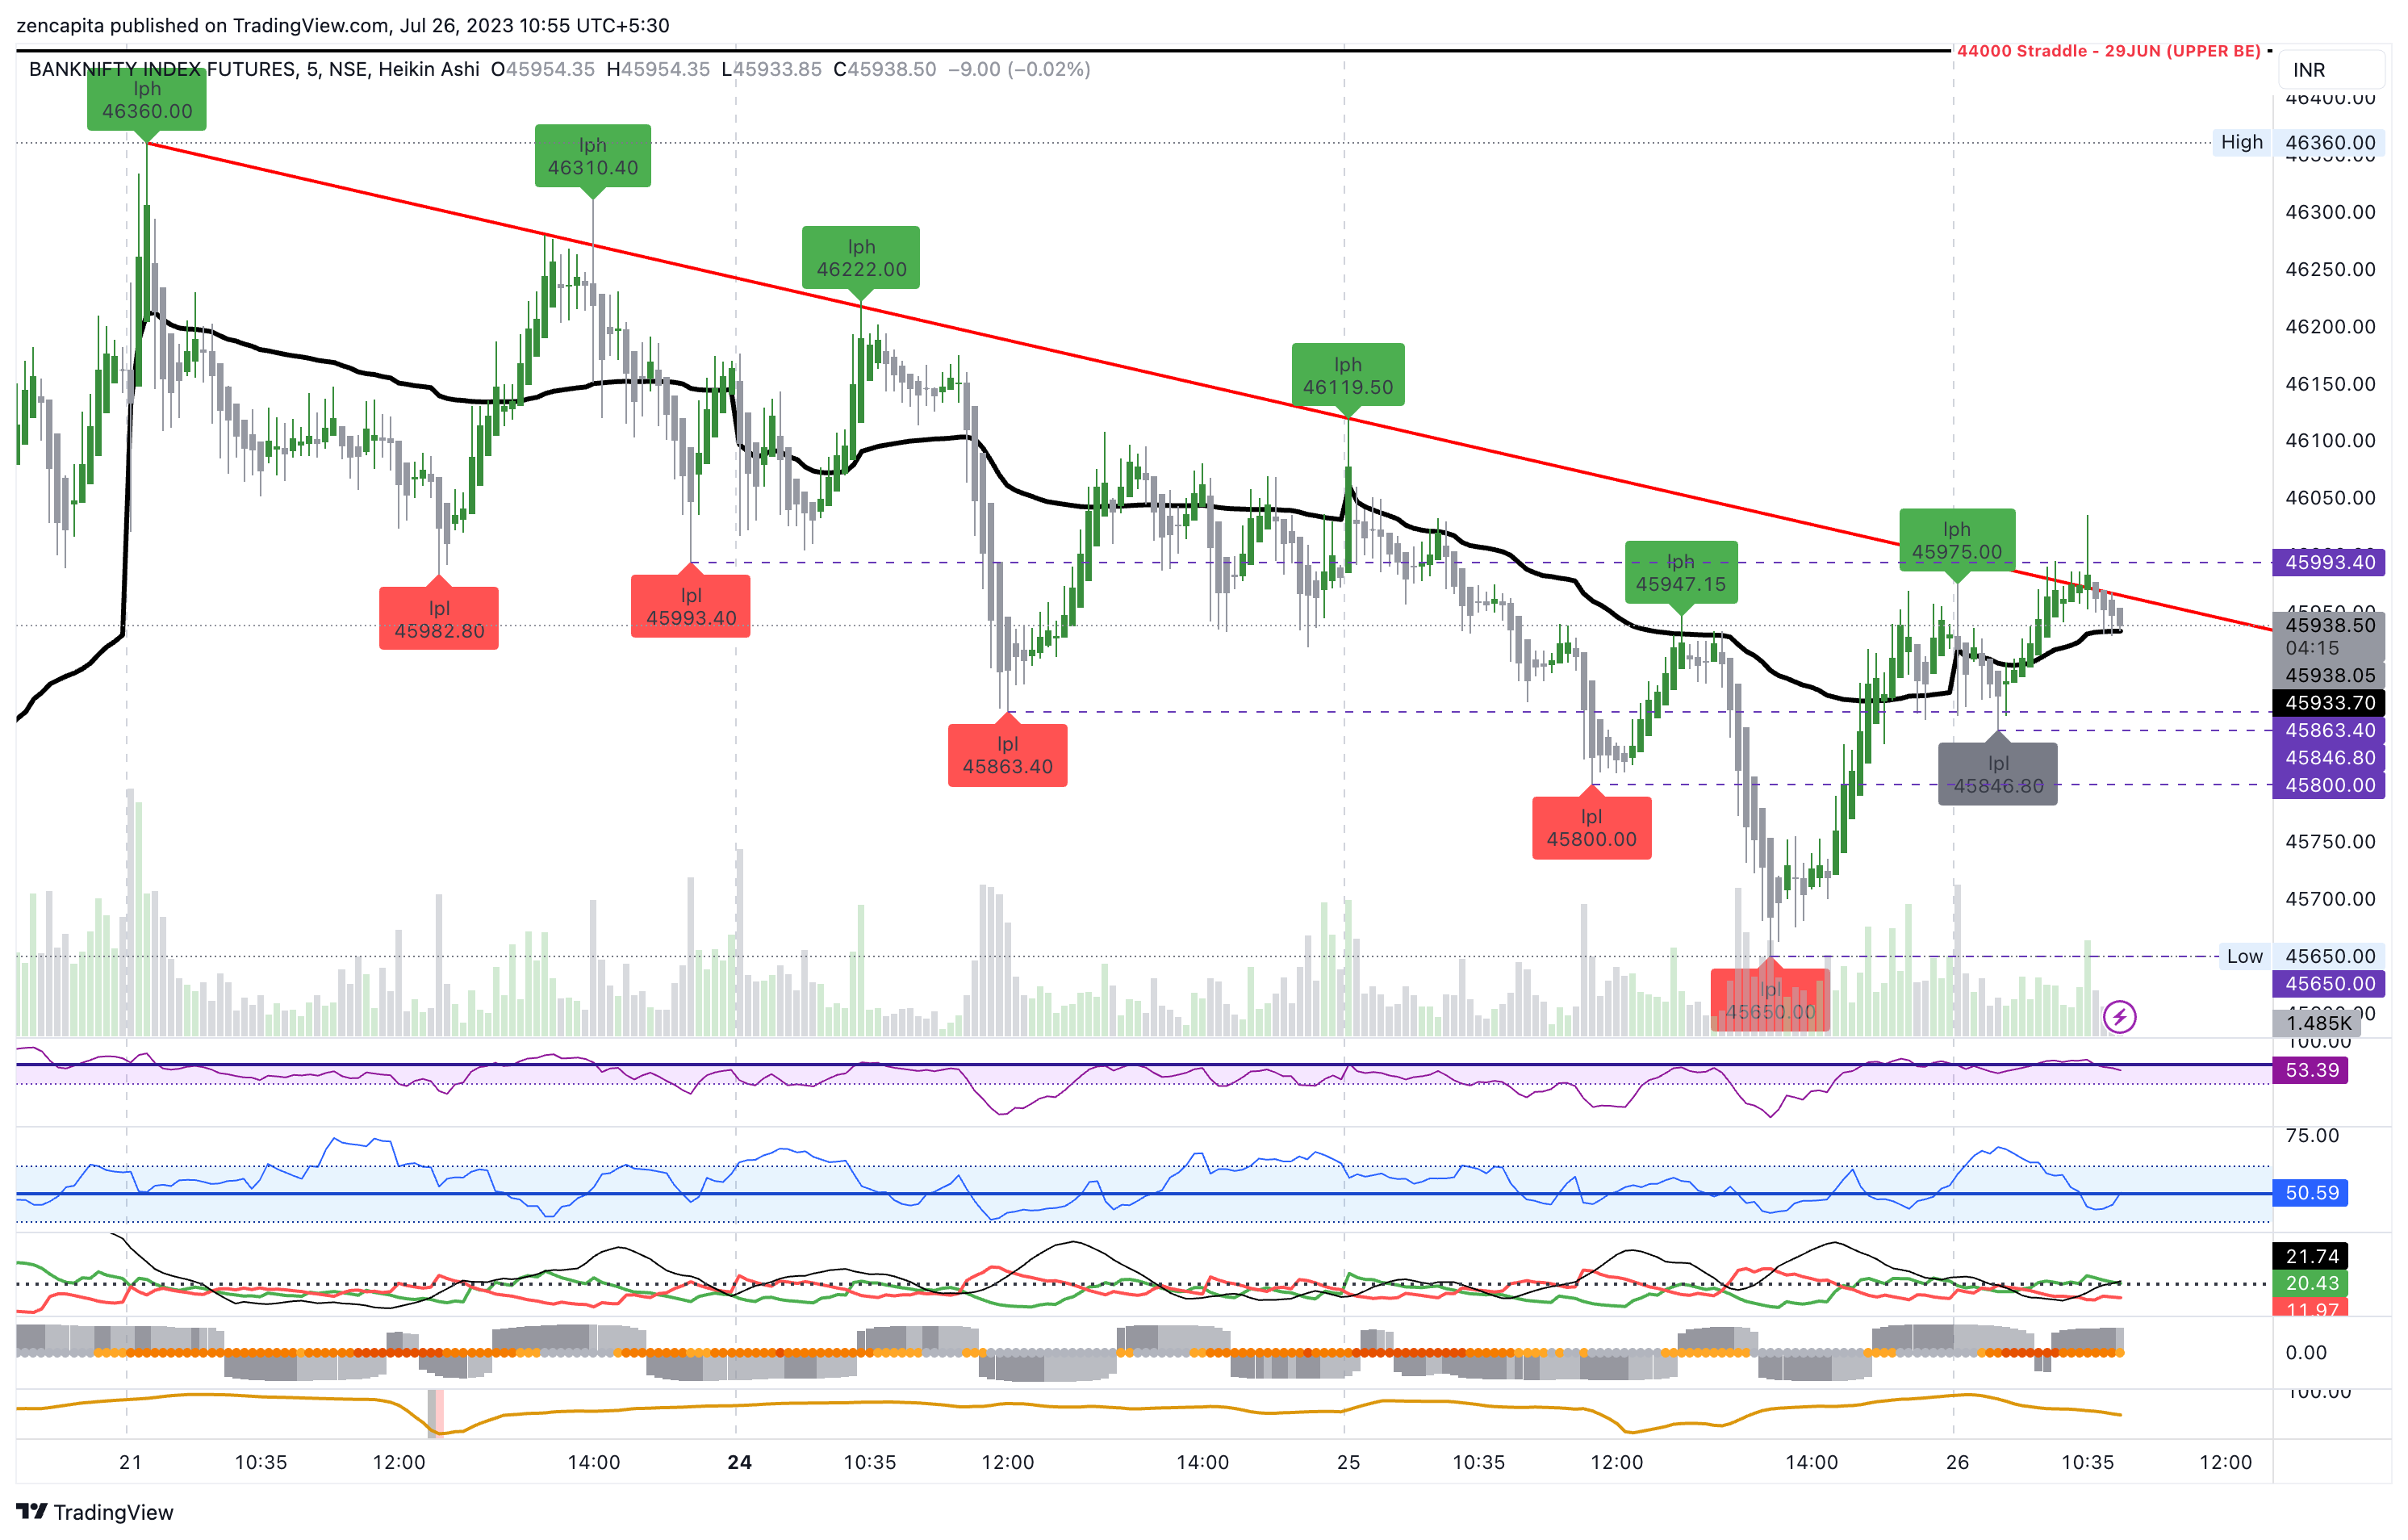
AND... within no time, that last LPH did not sustain (notice the grey has gone) - making the previous LPH as the official one. Again it looks like a LPL has also formed (in gray) but not yet confirmed. If that breaks, we'll see. But it looks like this sideways consolidation could continue for the rest of the day. With many booking their profits prior to the close, so they can stay clear from an event - The Fed Meeting.
It looks like there was an attempt to break the trendline, but the move wasn't strong enough. Maybe we'll see a retest of the lower levels now.
Member discussion