How To Read An Options Chain (Table)?
Before you start your first trade, you need to learn how to read an ‘options chain’ or as some call it an ‘option table’. An options chain is basically a list of all available option contracts for a given stock and their different expiration dates, so you can choose.
And because there are basically two different types of options — puts and calls — an option chain will list all the put option contracts and call option contracts available for a particular stock along with all the expiration dates — which are in monthly or weekly increments, so you’ll have various combinations presented as ‘option codes’.
Given the number of stocks listed on an exchange and various possible prices of a stock as well as the various possible expiry dates, there are over 1 million option codes to choose from.
For example, whilst there can only be one price at a point in time for stocks, option contracts can have multiple prices expiring in various time frames… you can buy an option contract for a share at $30 strike price, or at $40 strike price or at $50 strike price and to make things more complex, you can buy for October, November or December or any month. But only a few are barely worth your attention.
Your goal should be to create a shortlist of 30 stocks to watch and trade regularly (remember, this is a beginners guide, so if you really want to get some action — then you’ll have to check out my advanced course for more).
No one has really figured out a way to simplify how options chains are presented — graphs don’t cut it — so you’re left with a dry table. And the problem starts when you look at various financial websites or online brokerages — each displays them with different layouts, even though the content is basically the same.
In any case, the options table or chain will be divided into two parts — with calls on one side and puts on the other side (see the following screenshot). However, there are some common elements across the board and they are:
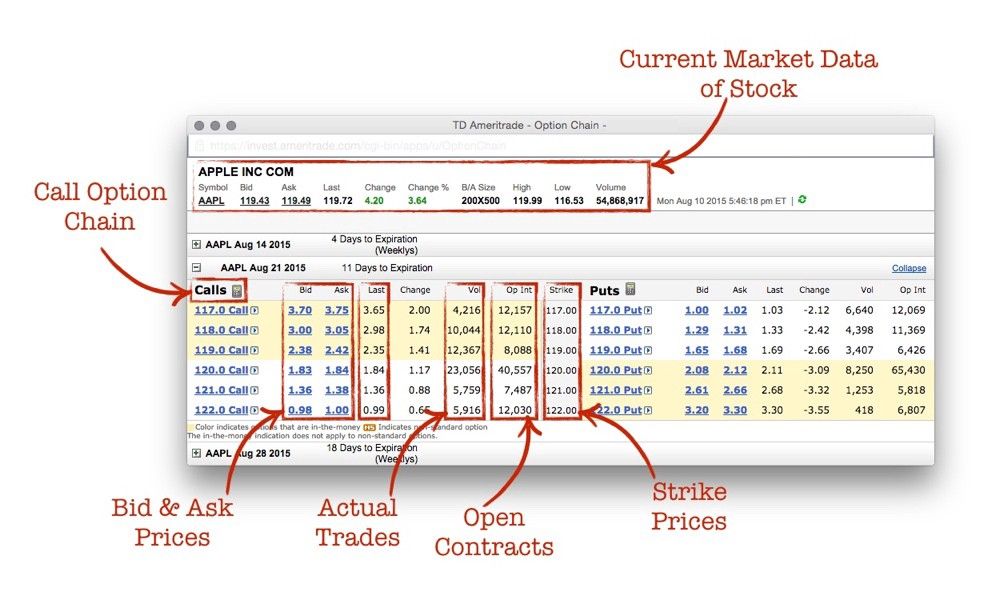
The above shows the call and put options that expire on 21 August, 2015 which is the third Friday of the corresponding month. You may also notice that the also have weekly options, which is also on a Friday — but you don’t require that for now.
Symbol — lists the trading symbol to identify each stock option contract available. There is a specific coding format which is followed to identify the stock, the strike price, the month it will expire and if it is a call or put option. You really don’t need to know this, as your brokerage will make it easy to buy and sell options without the code — but here’s an example: AAPL150821C117 which simply follows the format:
<TICKER><YY><MM><DD><CALL/PUT><STRIKEPRICE>Strike Price — this lists all the available strike (exercise) prices at which the stock can be bought or sold when the option is exercised.
Change — this lists the change in the options price. It shows how much the option price has risen or fallen since the previous day’s close — in absolute and/or percentage terms.
Volume — lists how many stock option contracts were traded throughout the day.
Open Interest — this lists the total number of option contracts still outstanding. These contracts have not been exercised, closed, or expired. The higher the open interest, the easier it will be to buy and sell the stock option because it means there are a large number of traders trading this.
Expiry Month — here’s where you see differences in the layouts. Depending on the month you want, there are options created by the market makers for you. Sometimes, you may not see each and every month.
Bid (Price) — is the highest price that a buyer is willing to pay for a particular stock option contract. This is the price other buyers are ‘offering’. The market is basically like an auction, there are various bids (offers) made by willing buyers who want that particular item. (When you sell an option, this is the price you’ll receive for the stock option). Once you own an option, the only number you’re interested in is the bid. The less you pay, the better.
Ask (Price) — is the lowest price that a seller is willing to accept or receive for a particular stock option contract. This is the price other sellers are ‘asking’. This is where you can see the various offers being made to the market for the stock option.
Last (Price) — this lists the last price at which the option contract was traded. It’s the last transaction price. This price could have been a few minutes ago, days or weeks ago — you never know.
Remember, in the case of bid, ask and last — it is just for the price of one share, when you buy or sell the contract (which is a basket of 100 shares) — you need to multiply this price by 100.
Bid/Ask Spread: The difference between the bid price and the ask price is what we simply call the spread. Pay attention to the bid, as that is what market makers (those who create the market for traders) manipulate to profit the most. Often, beginner (or rookies or amateur or newbie, call them what you will) traders jump in and pay the last price traded i.e. the market price, and make a loss before they’ve even started.
No wonder 90% of options lose money… well, here’s how you can beat the market makers and get the right price! In our example above with Apple (APPL) stock, you’ll notice for the 119 call option, the bid is 2.38 and the ask is 2.42, which gives a spread of 0.04. If you were a beginner, you’d jump right in and place an order for 2.38. And because the last traded price was 2.35, you’d be down immediately by 1.2%. If the spread was higher (which happens for not so active stocks) — this difference could be as large as 15%. So…
ALWAYS Use Limit Orders: You can place trades between the bid and ask, in 5 cent increments. This way you can pressurize the market maker to alter the price and reduce the spread. This will require a little patience (yes, that’s a virtue), but you’ll get a better deal. Even the 5 cent difference can really affect your returns in a big way because you’re buying in buckets of 100 shares. Let’s take the same example…
You would instead place a bid at 2.35 or 2.30 and wait. Yes, patience is a virtue. At least, you’ll start off on a good footing. This has its drawbacks, for not so active stock option and usually ones with a larger spread, the best option would be to take the average between the bid and the ask. So in our example with AAPL, you would bid 2.40 — and this would surely be executed.
After reading all this — you might be ready to jump into the game. Ok, to get you started — you’ll need a brokerage account that handles options trading. Check out the about page, where you can learn which are the best brokerages and how you can get approved (yes, you need to get approved for options trading!) Next, we’ll discuss four basic (and simple) option trading strategies…
Member discussion