Market View 20230811
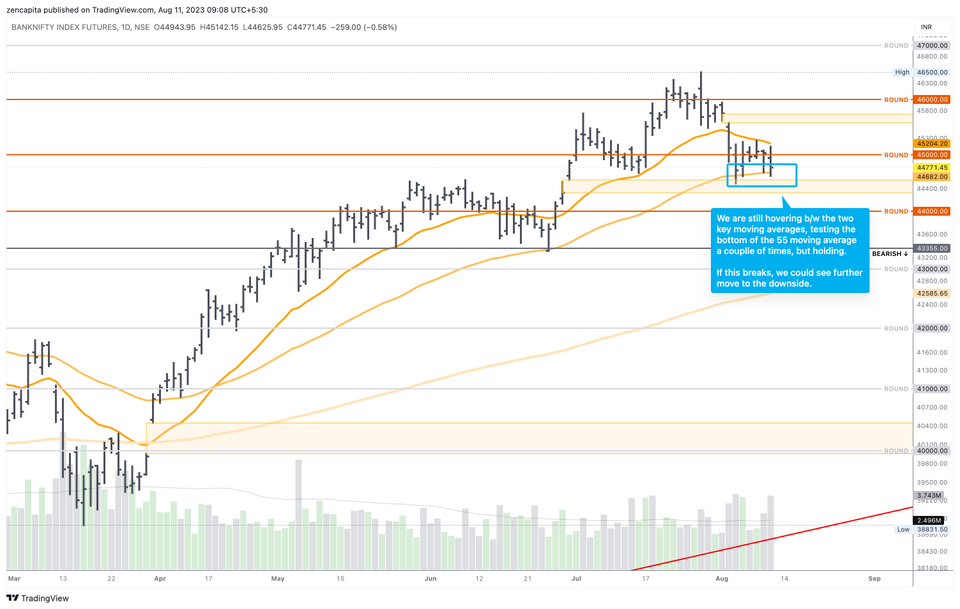
We are still hovering b/w the two key moving averages, testing the bottom of the 55 moving average a couple of times, but holding above it for the eod. If this breaks, we could see further move to the downside.
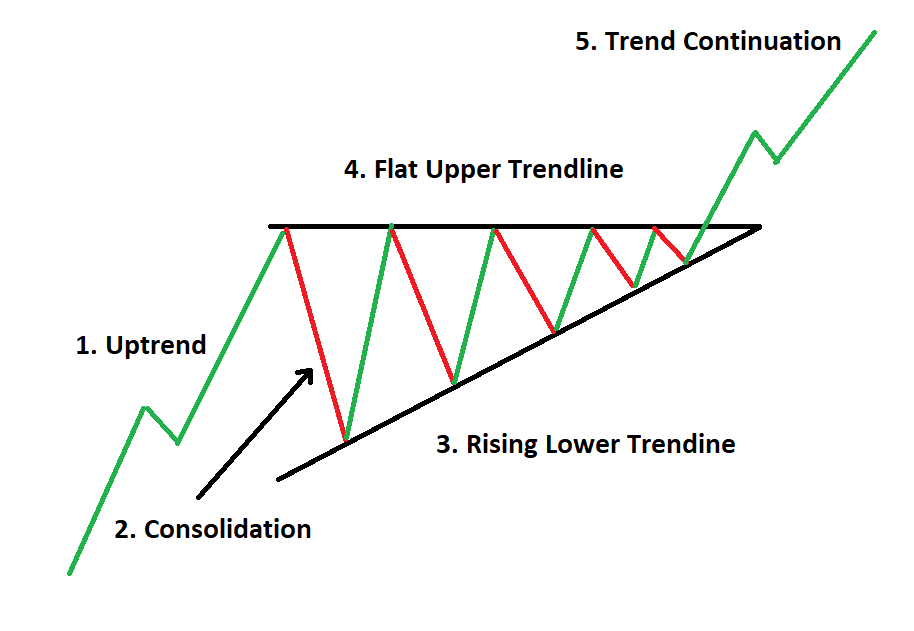
What the chart patterns tell us:
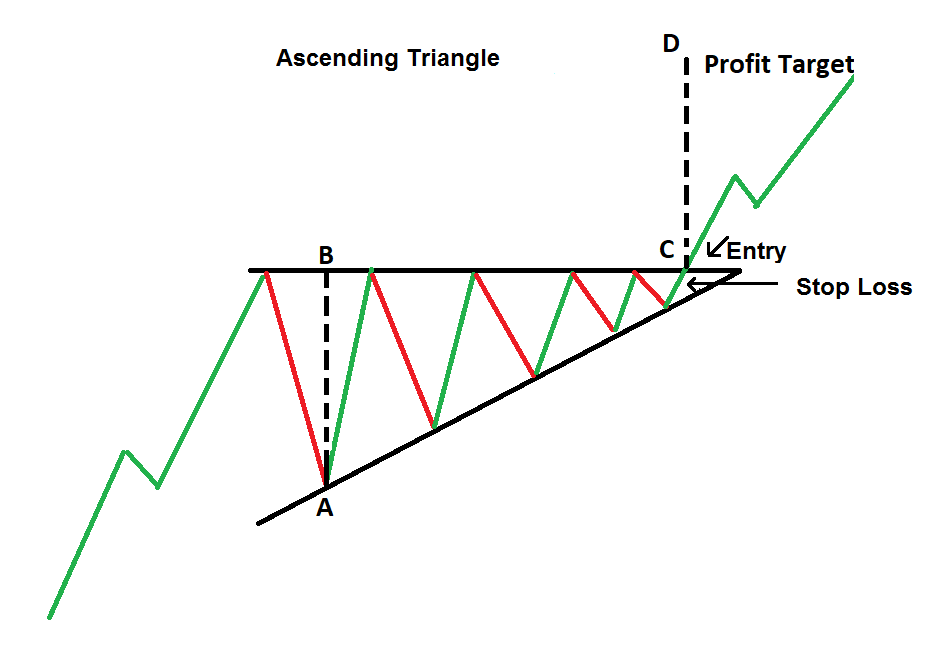
So how do you take advantage of this chart pattern? Well, find the widest point in the triangle, where you see a resistance and support, and then extrapolate that distance to a profit target.
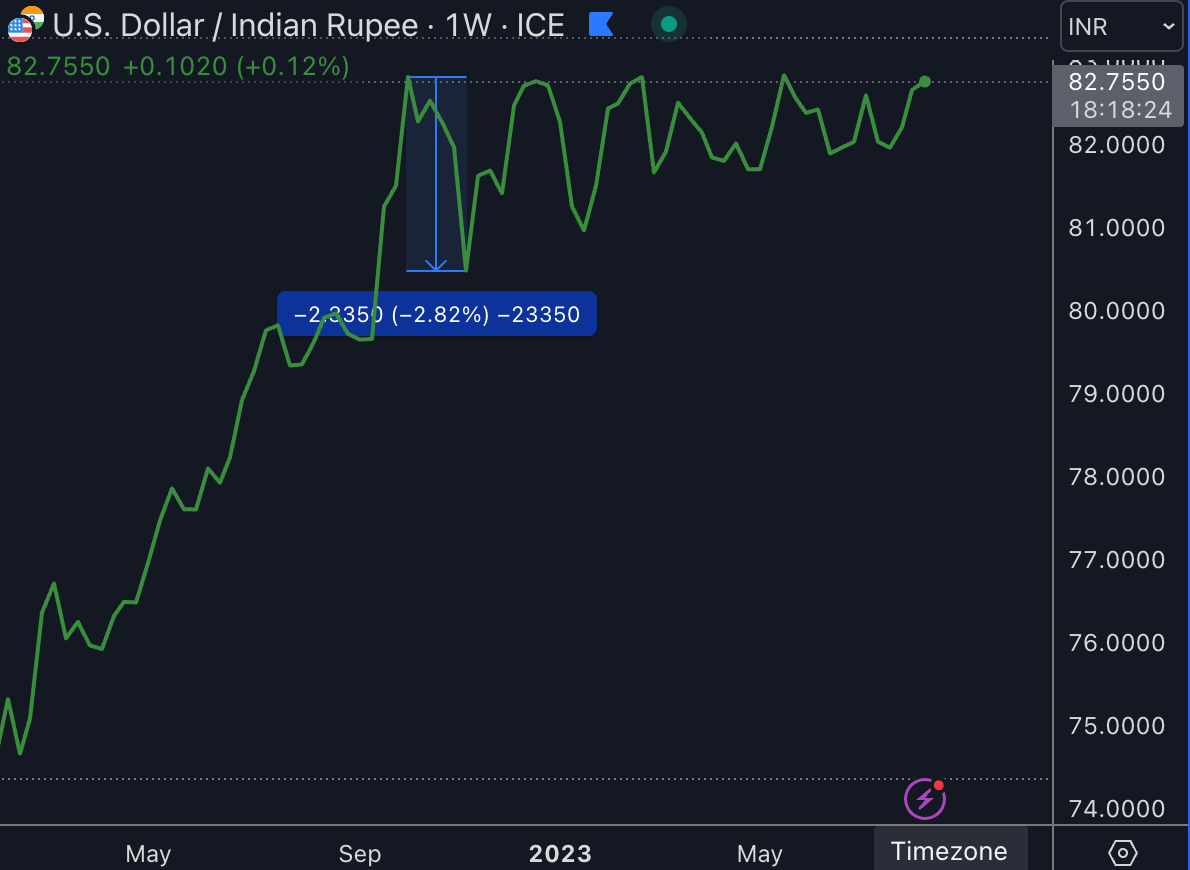
And now let's look at the USDINR chart... see anything familiar?
10:43 AM
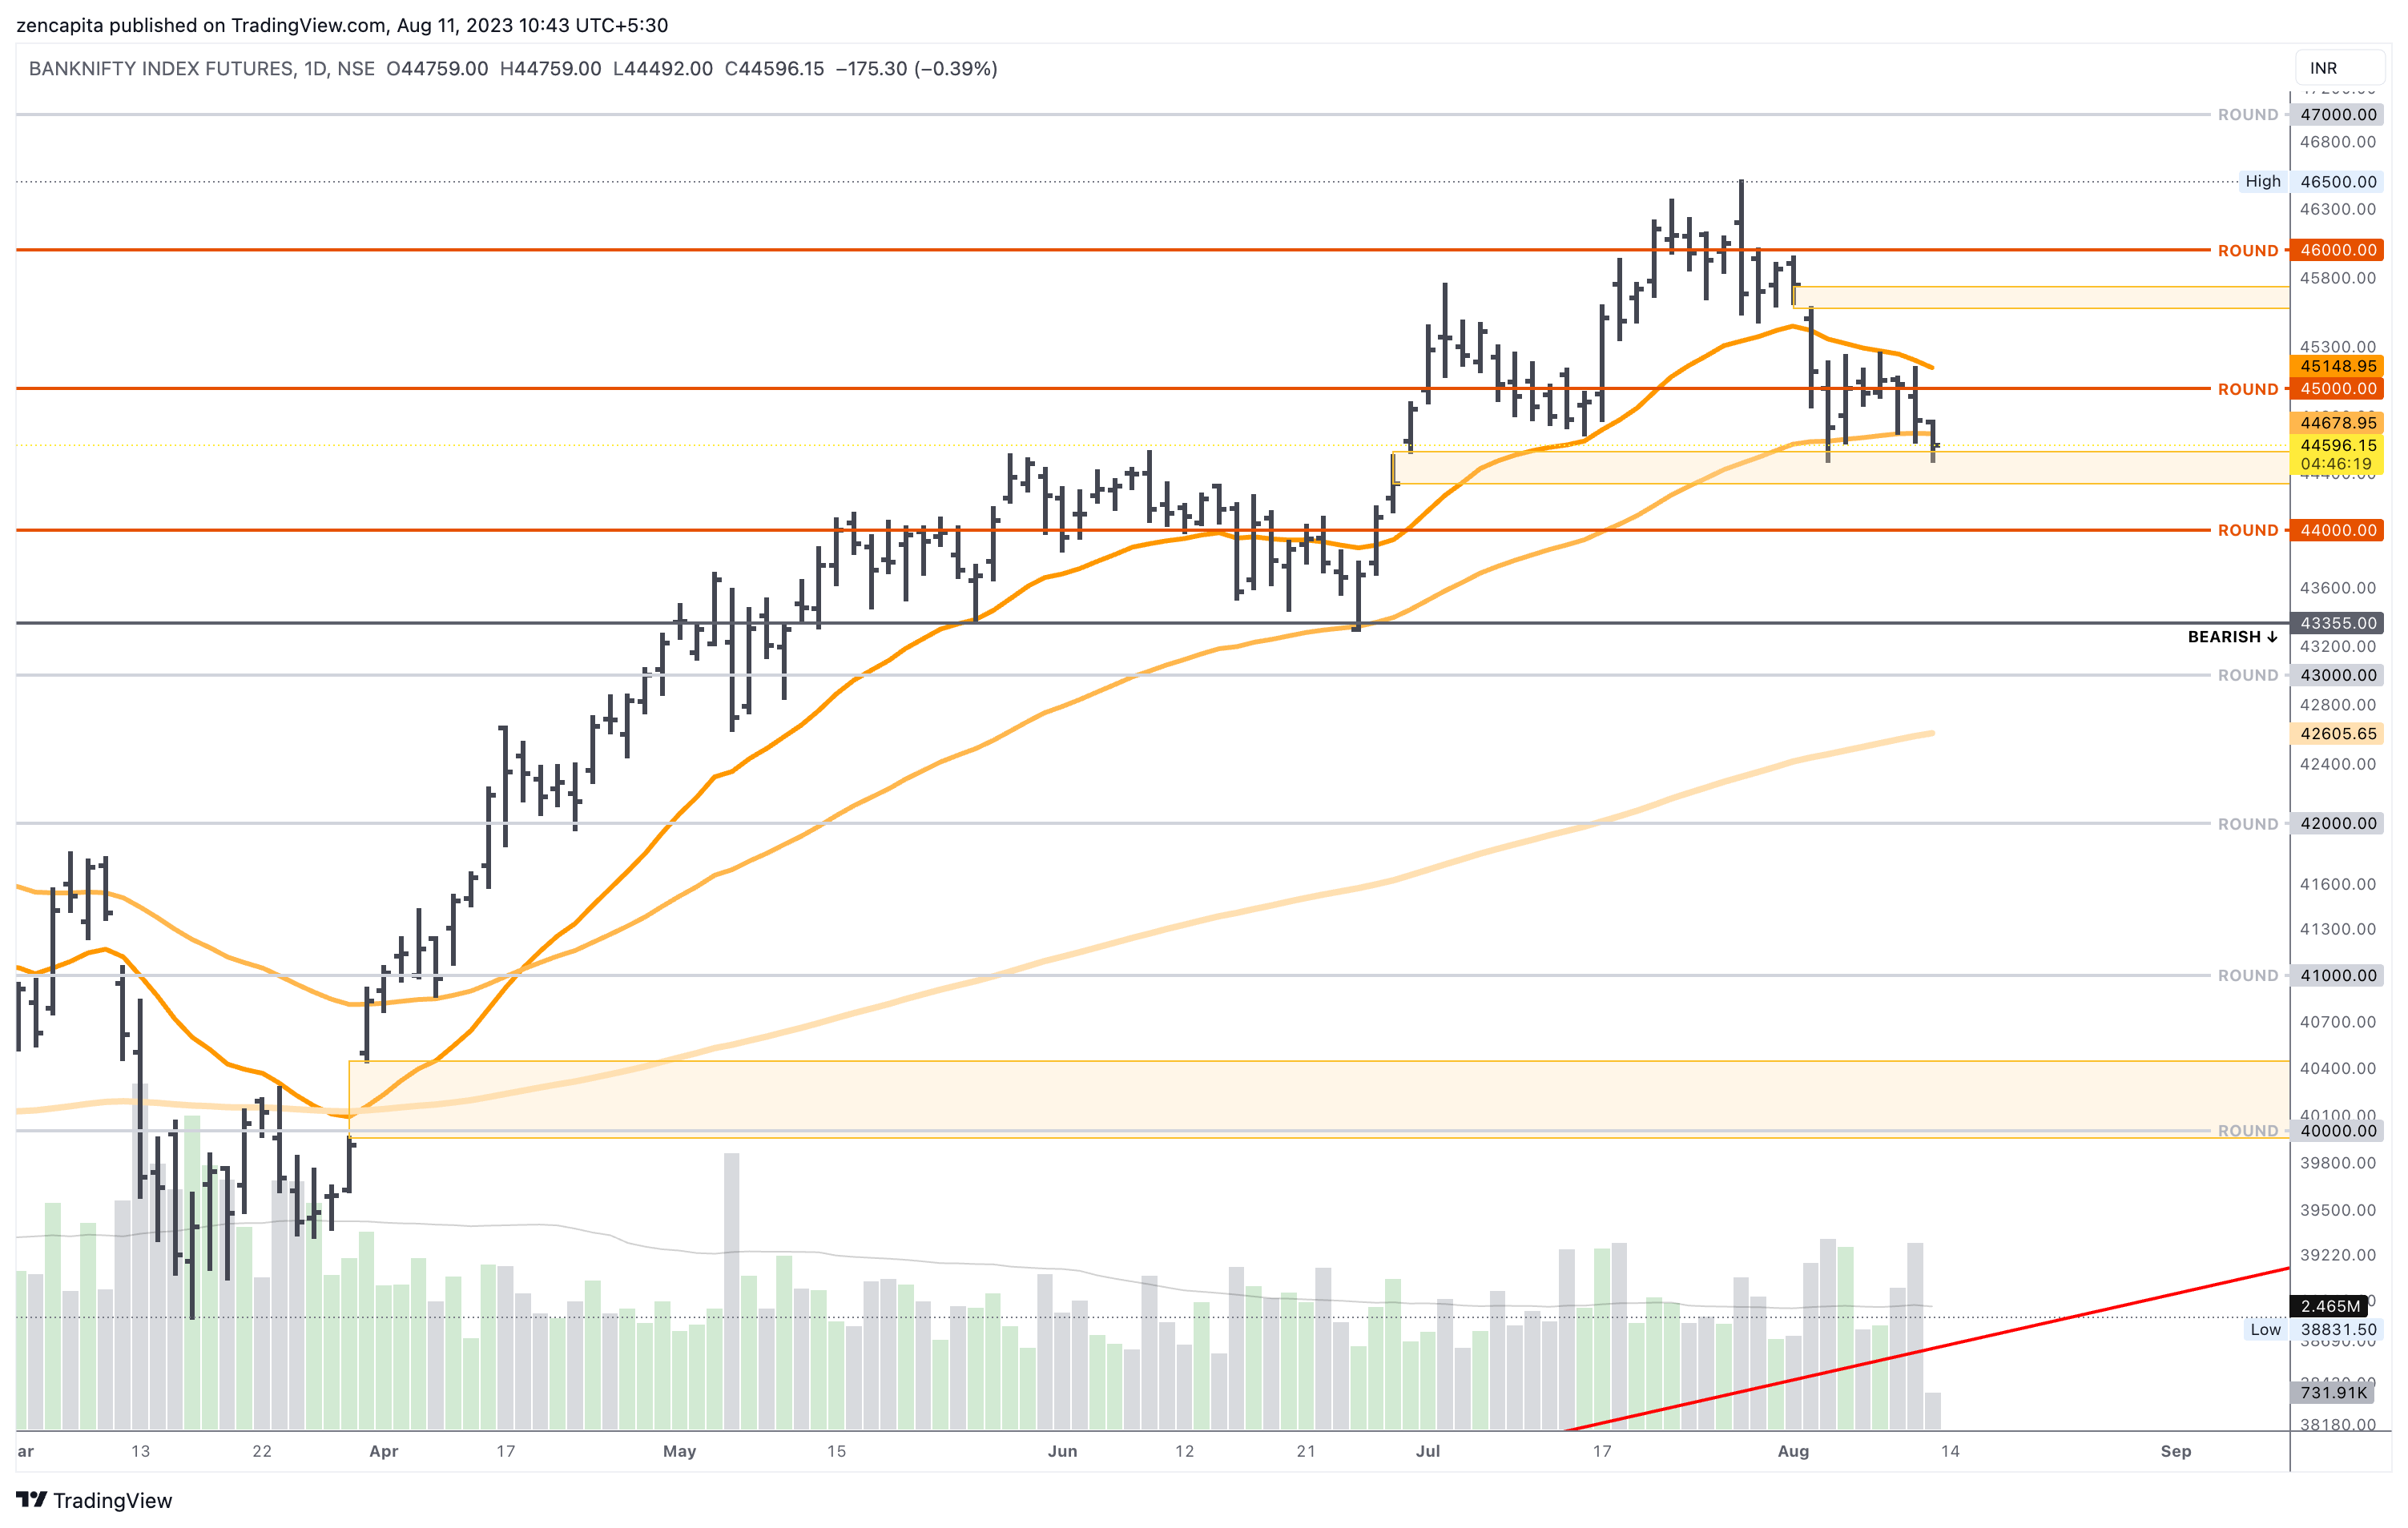
We've entered just below the 55 moving average, if it closes below this, we could see a further move down. I'm guessing that 44000 is the key support.
3:29 PM
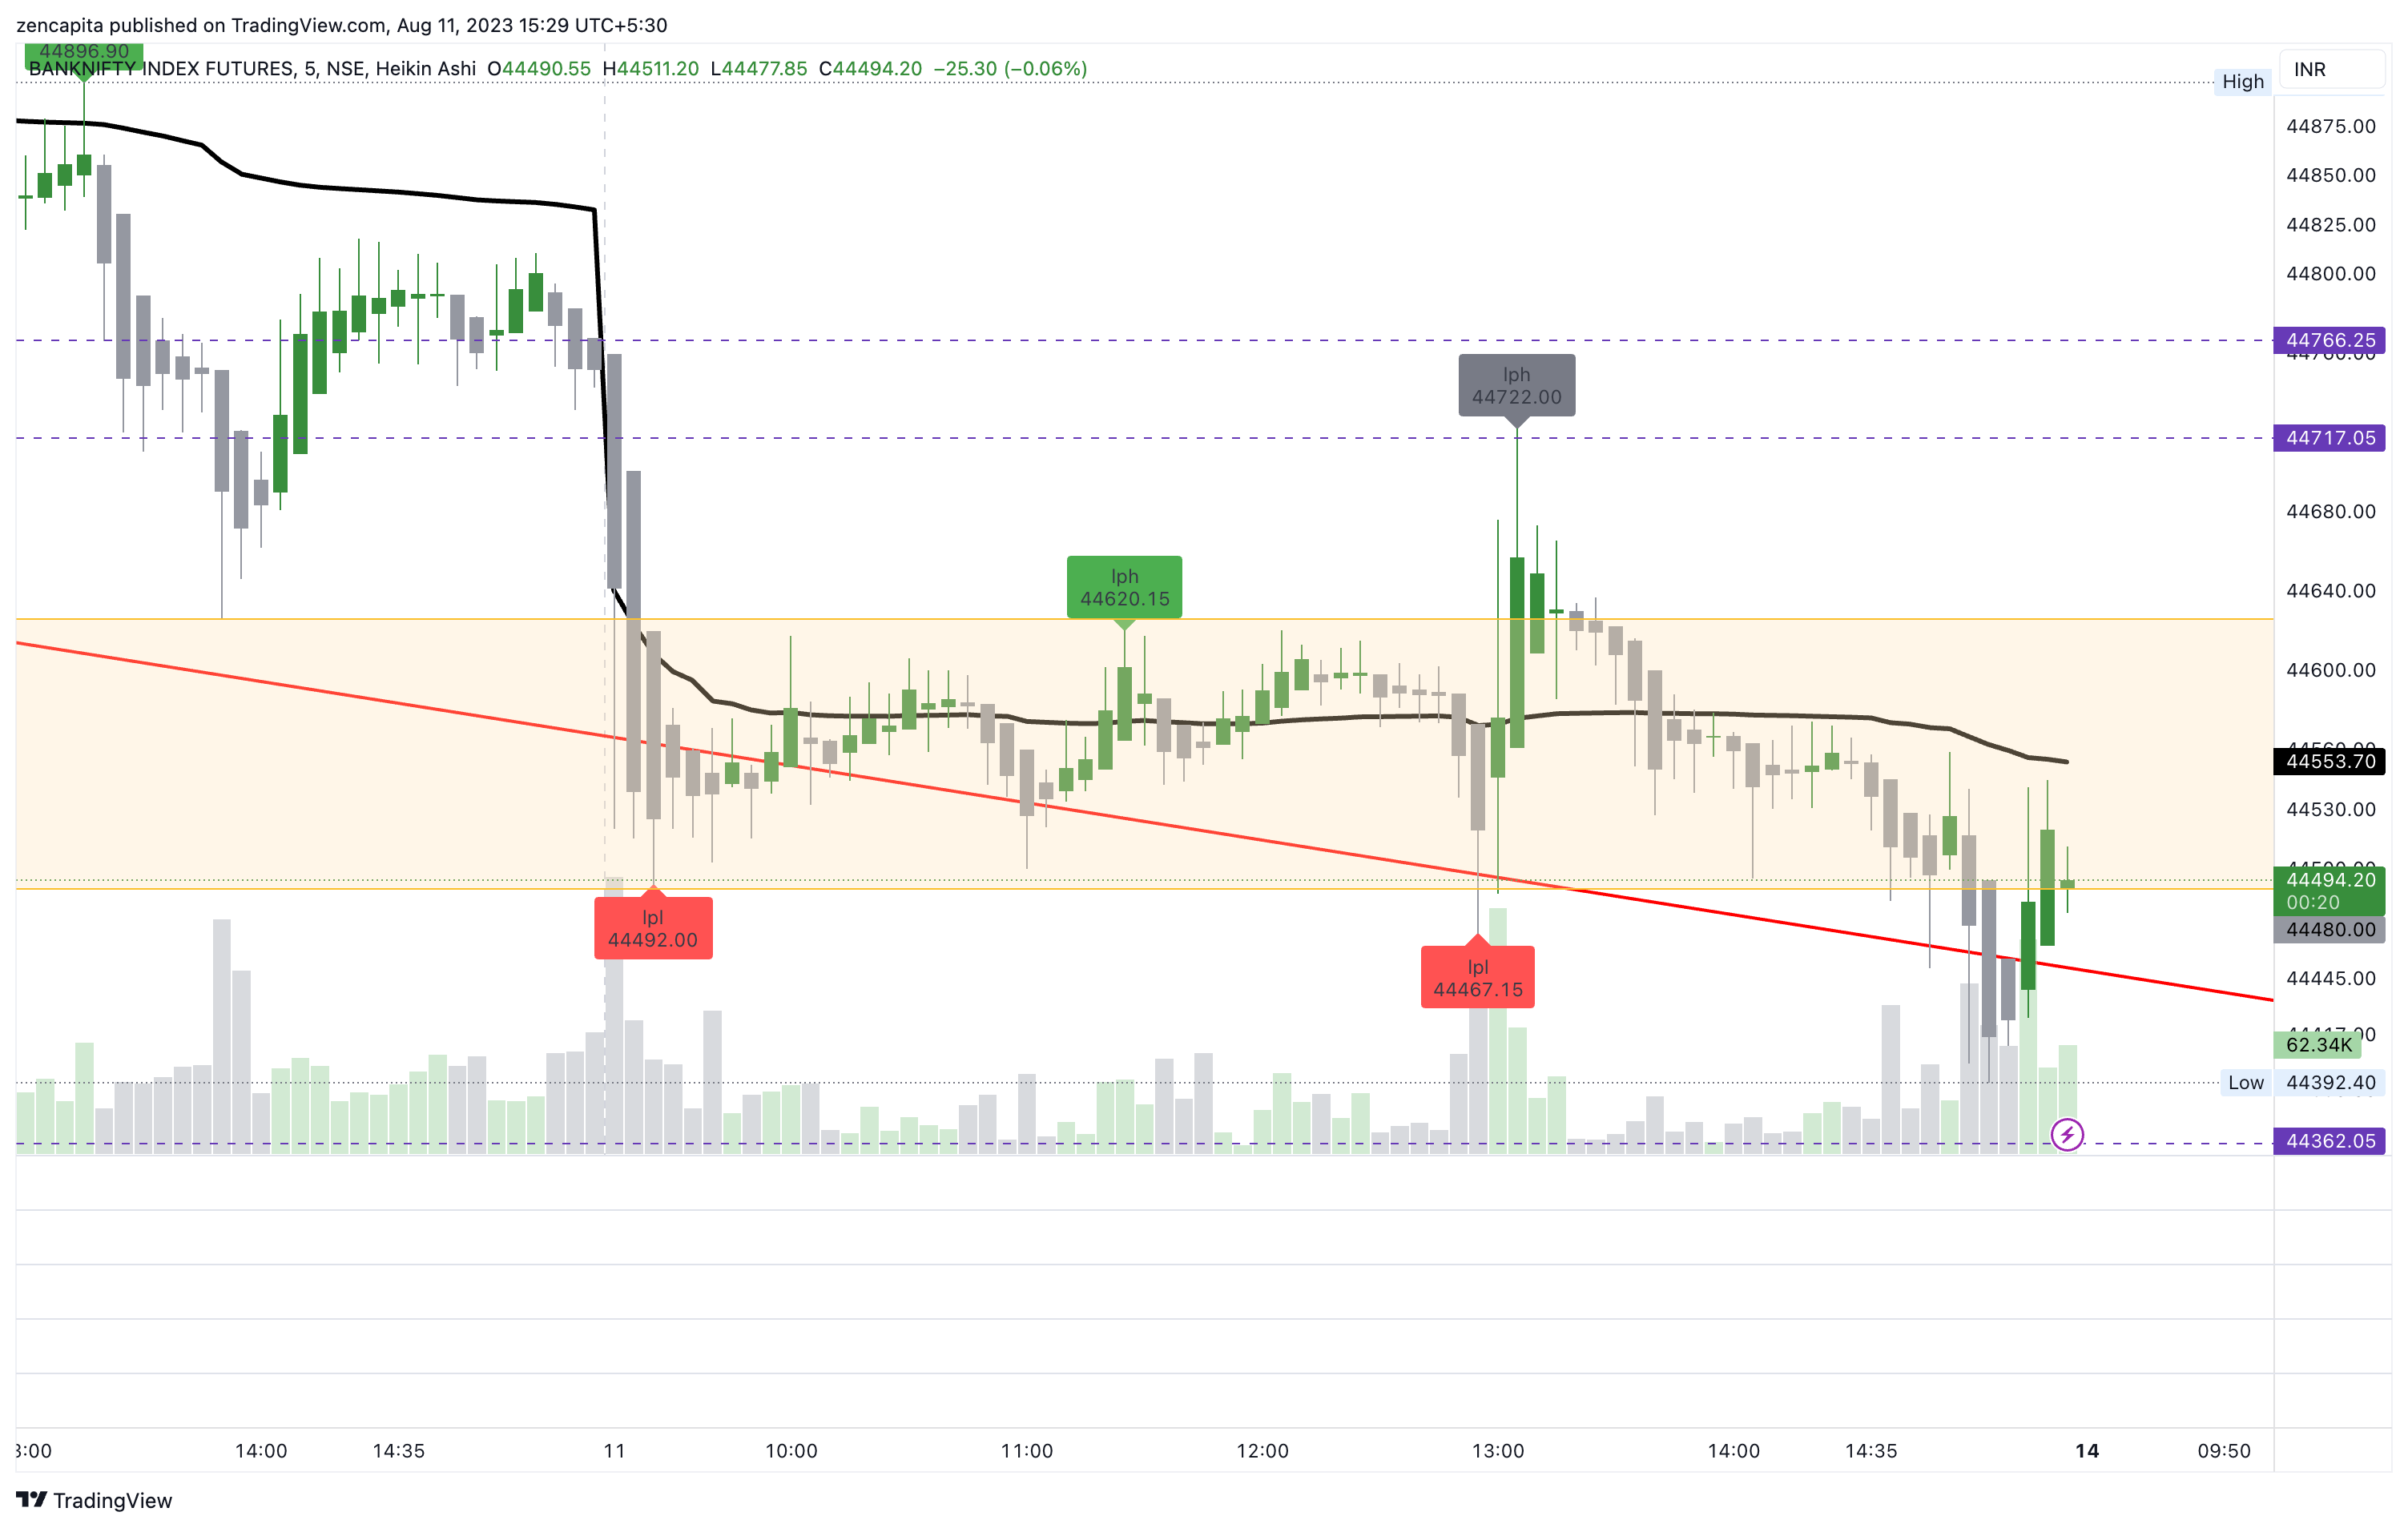
Looks like we're still closing above the downward trend line. The weekend will bring some decay, looks like a slow decline. Which could lead to a pop like we had earlier. Let's wait until Monday morning to take a call.
Member discussion